Benchmarking Self-Hosted Models on an RTX 3090: My Own Two-Score Test Bench
I wanted to know what’s genuinely possible with self-hosted models running on my RTX 3090 — not from marketing pages, but from my own workloads. Off-the-shelf benchmarks didn’t answer the questions I actually have, so I built my own specialized benchmark with two suites: one measuring assistance capability and one measuring content writing ability, tested across every model I can serve locally. The repository holds both the automation for the test bench and the results, published to a live interactive dashboard.
Two suites, two scores — deliberately separate
The core design decision: these measure different work and are never merged.
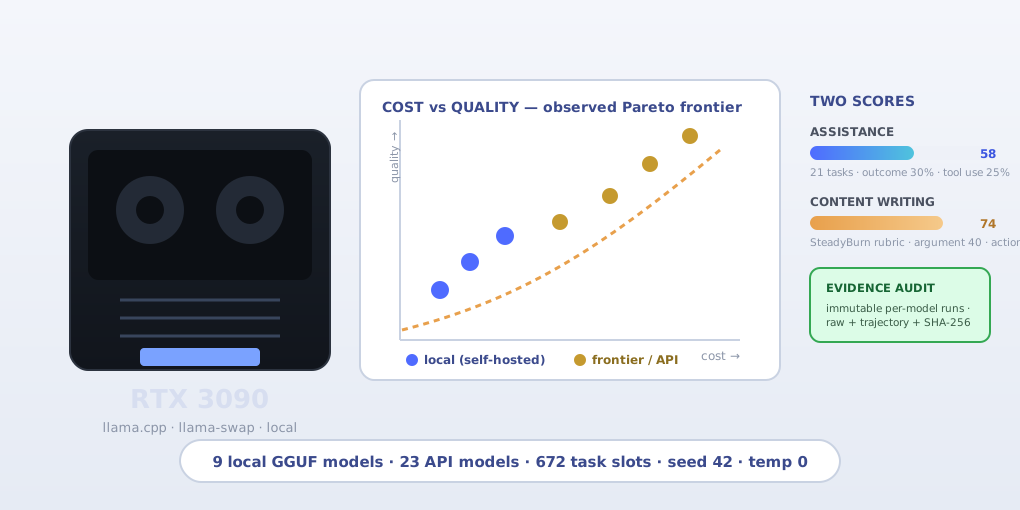
Personal-assistant benchmark. Nine local GGUF models (plus 23 OpenRouter models for comparison) run 21 synthetic information-worker tasks — project, calendar, email, research, data, English, safety, judgment, and multi-source scenarios — a total of 672 task slots. The assistant score is a weighted total: outcome 30%, tool use 25%, grounding 15%, state management 10%, English 10%, safety 5%, efficiency 5%, with time reported separately so latency never pollutes the capability score. The protocol is strict enough to be trusted: one model loaded at a time, explicit unload with a 10-second empty buffer between models, temperature 0, seed 42, a 768-token per-turn cap, and a fixed six-turn tool-loop ceiling.
Content-writing benchmark. This one scores models on producing a complete client content bundle — context, lesson, instructions, worksheet, long-form letter, newsletter email, community post, and rendered hero image — judged against the SteadyBurn rubric: argument 40, grounding 15, action 15, readability 15, closure 15, with tone penalties for motivational-therapy slips. Readability is measured deterministically by a syllable heuristic after stripping Markdown. Cost case studies compare every run against the local baseline with provider-reported usage.
The local cohort
The models that fit my card at Q4 quantization tell a fun story: Cydonia 24B, Dolphin Mistral 24B Venice, Qwythos 9B, Gemma 4 12B Obliterated, Gemma 4 E4B, and a fleet of Qwen 3.6 variants (27B and 35B A3B in several finetune flavors). The dashboard’s first chart is the decision view — a cost-versus-quality scatter with the observed Pareto frontier, local models as the affordable baseline against the frontier APIs, so “is the 3090 good enough?” becomes a point on a chart rather than a vibe.
The evidence pipeline is the research
This is where the repo stops being a spreadsheet and becomes infrastructure. Every local run produces an immutable per-model bundle: raw results, normalized task records, ordered trajectory, configuration, lineage, manifest, and SHA-256 artifact hashes. The run explorer labels every comparison as directly comparable, directional, or not comparable from the benchmark-contract metadata — it will refuse to overclaim. The browser does the work through an operator monorepo: a PostgreSQL-backed durable command queue, CQRS event sourcing with a read-only event-history container, a worker that selects and downloads GGUFs and runs cohorts serially, daily discovery of new eligible models, and a publisher that rebuilds the static pages and pushes its own focused commit to main.
What it taught me
Self-hosting changes the benchmark question from “which is best?” to “which is best at the price my GPU charges?” — and the honest answer requires both axes. A model that writes beautifully but drifts in tool loops is a liability as an assistant; a task-cracker that writes generic prose fails the content suite. Splitting the score kept those two truths visible, and the Pareto frontier turned them into a decision.
The other lesson is that benchmark results you can’t audit are just advertising. Fixture hashes, immutable runs, and explicit comparability labels are what let me trust a number enough to bet a content pipeline on it. It’s research I’d be comfortable showing a skeptical reviewer — because it’s built to survive one.