Fire & Strike: Monte Carlo, Percentiles, and the Price of Retiring on Schedule
I’d specified a FIRE dashboard (its spec lives here) that answers “how much must I save next month?” Fire & Strike is the implementation that went further — from deterministic arithmetic into simulation, and from reporting the present into solving for a decision (source on GitHub).
The two use cases
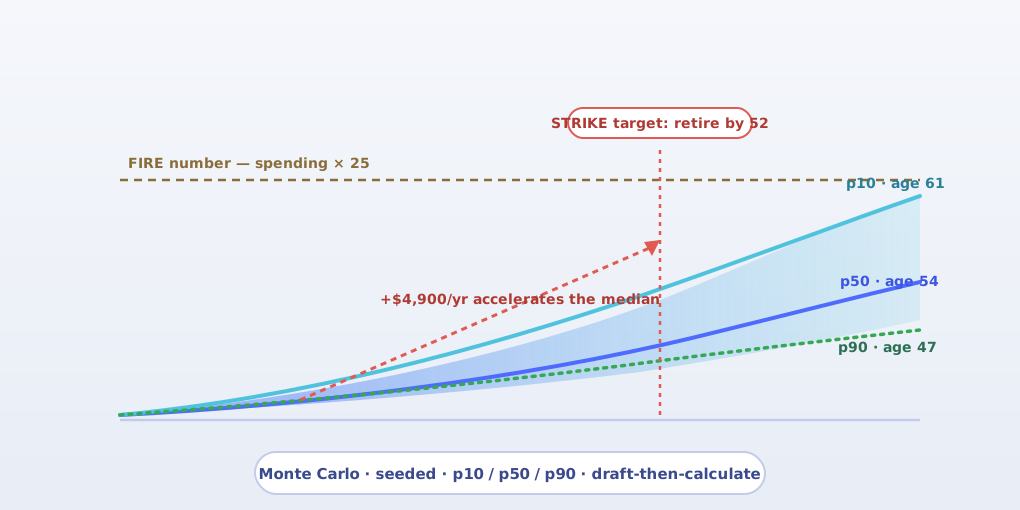
FIRE projection (current pace). Enter your expected retirement spending, current age, portfolio value, and yearly contribution, and the app runs a Monte Carlo simulation over real (inflation-adjusted) returns — charting p10, p50, and p90 paths of portfolio value against age, each percentile stamped with the age it crosses your FIRE number (spending × 25, the 4% rule). The pessimistic path is the honest one: it shows what “market does poorly for a decade” does to your date.
STRIKE plan (accelerated pace). Declare a target retirement age, and the app solves for the extra yearly contribution required so the median path reaches FIRE exactly then — “50% chance” confidence, by design. It charts the accelerated p50 against your current-pace p50, so you can see the price of the date you chose in dollars per year.
The engineering
The spec of record (with a DDD ubiquitous language — FireGoal, AllocationMix, DrawRate, Pace, Crossing age, StrikePlan) drove the build, and the architecture is strict onion: pure domain services (MonteCarloFireProjector, GaussianReturnModel, StrikePaceSolver, PercentileAggregator) behind ports, application use cases (ProjectFireTrajectory, SolveStrikePlan) orchestrating them, and a seeded RNG adapter (Mulberry32Normal) in infrastructure — seeded, so simulations are reproducible and testable rather than luck-of-the-draw. A arch-unit test (boundaries.test.ts) fails the suite if any domain file imports React or anything outward-facing.
The interaction model is unusually disciplined for a calculator: every edit is a draft — nothing simulates until you press Calculate, which keeps typing responsive; values are never clamped mid-edit (clear and retype freely); invalid drafts get warnings and red aria-invalid outlines instead of silently “fixing” your numbers. Defaults live in a collapsed Advanced section: 4% draw rate, 7%/2.5% real returns, 18%/6% volatilities.
And the build itself is part of the experiment: the repo is designed for the Ralph Wiggum loop — an agent executing the first unchecked task per strict TDD, gated by npm run gates (lint + typecheck + tests) before every commit, with GitHub Pages deploying on every push.
What it taught me
Percentiles are the honesty layer. A single projected retirement date is a confident lie; p10/p50/p90 turn the same simulation into a range you can reason about — and STRIKE’s insistence on solving for the median (not the optimistic tail) is the same honesty applied to the plan: you’re paying to move the likely outcome, not the lucky one. The other lesson is process: TDD plus a spec of record plus a gate-running loop meant the agent iterations were nearly boring — the good kind of boring, where the tests are the only error correction you need.